
Two unique centuries: The Great Acceleration
The last two centuries in human civilisation have seen staggering changes to wellbeing, sustainability and inequalities. What are these changes and how do they influence our view of the future?
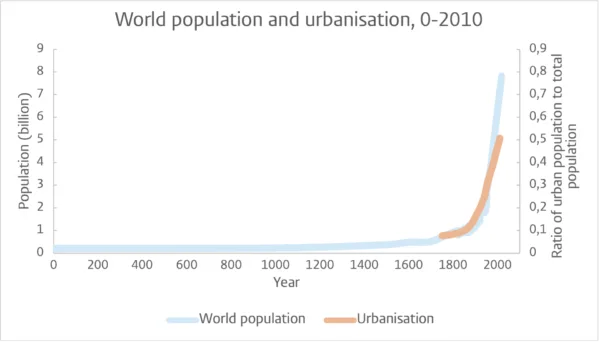
For most of the last 2000 years, the global population has been relatively steady at around 250-500 million, roughly between the size of Indonesia and Europe. Of course, some regions experienced rapid increases and rapid declines in population, but on the whole the global population remained remarkably stable. Global population reached its first billion in 1800 and just 200 years later reached 8 billion.
As populations and consumption grew our surroundings changed dramatically. In 1800, less than 10% of the global population lived in urban areas, growing to over 50% today. Compared to our great, great, great grandparents we are living with more people and in much closer proximity to one another.
The usual overview of human development over this time would include the level of economic growth, usually measured in long time series of GDP (Gross Domestic Product). However, this puts economic development at the core of the story and would show the rapid increase in material goods and services that the world produces and consumes. But this story is unsatisfactory and hides a broader, richer story.
A New Narrative: Wellbeing, Inclusion and Sustainability
To tell a different story we’ll dive into three important dimensions for human thriving: 1) Wellbeing (“Have lives become better?”) 2) Inclusion (“How is wellbeing distributed amongst individuals, groups and countries?”) 3) Sustainability (“Is the wellbeing of future generations okay?”). These three dimensions are often thought of as going ‘Beyond GDP’. Let’s look at each of these three dimensions in turn.
1) Wellbeing: better and longer lives
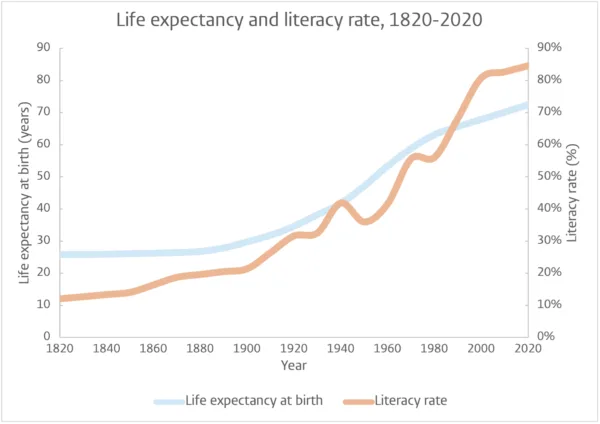
Many of the wellbeing data that we use today simply don’t exist far back in time. However, if we look at the few long-term datasets available, we find that the average person today is clearly better off than the average person 2 centuries ago. Just look at the staggering changes in health across the 19th century below. We see that life expectancy at birth was lower than 30 years in 1800 and infant mortality was shockingly high. Today, the global average life expectancy is more than double at around 73 years. However, very recently we are starting to see declines in some countries and within some groups – more on this later.
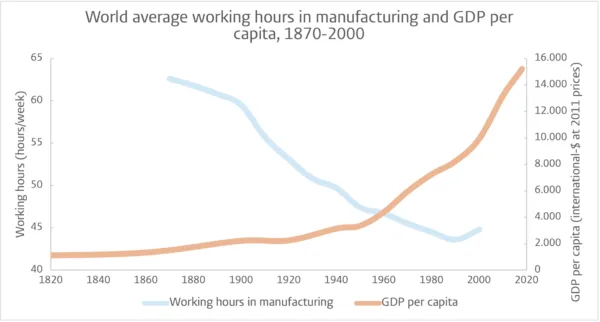
We have some long-term data on the number of working hours per week and here we can also see improvements. For manufacturing, we have seen a reduction in over 60 hours of work per week to just over 40 hours even as general economic production has increased rapidly.
2) Inclusion: is everyone's life improving?
Yet perhaps this is not the whole story. Average wellbeing hides differences between groups in society. If the richer get richer faster than the poor get poorer then average wealth can go up. Someone in the top 1% of income has a very different level of autonomy over their life than in the bottom 1%. Even if everyone has enough, what if you live in a country in which you have no say? Research demonstrates that humans need a sense of agency and to feel part of community to feel fulfilled.
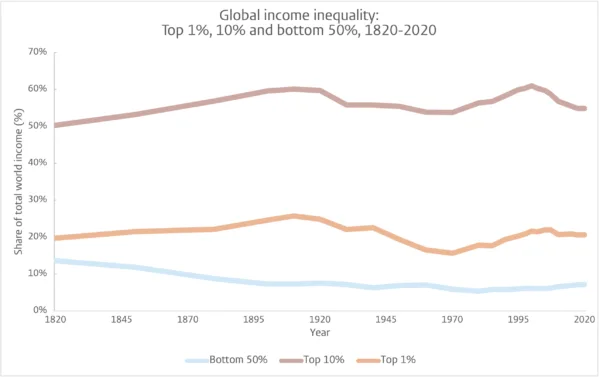
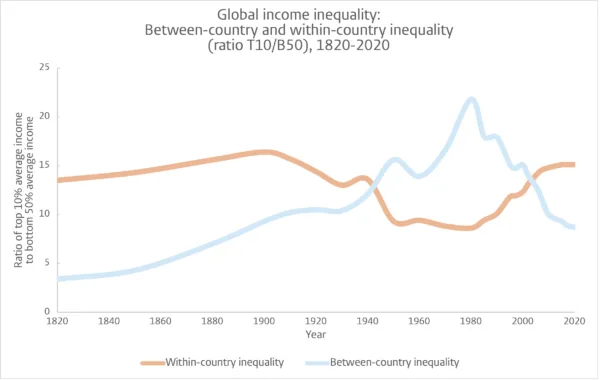
One way to consider the distribution of money is to take the average income of the top 1% and 10%, and then compare it to the average income of the bottom 50%. If we do this we see fairly small changes over time. For at least two centuries, the top 1% has had more income than the bottom 50%. The top 10% globally has consistently earned more than 50% of total global income.
If we divide the share in income of the top 10% by the bottom 50% both nationally and globally, we get the graph below. This shows us that inequality within countries has generally been high, with the top 10% earning 13.5 times more than the bottom 50% in 1820. After that inequality rose steadily till the highest point of 16.4 in 1900. In that same period, the period of colonial empires, inequality between countries increased even more rapidly. From the lowest point of 3.4 in 1820, between-country inequality rose to its highest point of 15.6 in 1980.
The 20th century shows a different pattern. Within-country inequality first dropped while between-country inequality kept increasing till about 1980, when the trend reverses and within-country inequality rose again while between-country inequality dropped back to the 1900 level.
Sustainability: maintaining a liveable planet for future generations
If inequality doesn’t paint quite as rosy a picture as average wellbeing, then things look even worse when we turn to the environment. The figure below shows how humanity has had a profound effect on our planet. We can take many different indicators, greenhouse gas emissions, fish caught, materials, biodiversity loss, among many others. We show six below: carbon dioxide, nitrous oxide and methane emissions, tropical forest loss, biosphere degradation and ocean acidification. We can see that each of the curves increase from 1750 but then rapidly rise from 1950 onwards to the present day. This recent acceleration in impacts has been called the Great Acceleration.
We have known for some time that these trends threaten the existence of organised society as we know it. The everyday impacts of climate change alone range from flooding to food shortages, water scarcity to sea level rise and the abandonment of coastal regions.
A different and worrying phase of human experience
The result is that much of the progress we have seen in the 20th century is starting to stagnate and even reverse in the 21st. For example, after decades of declines, food insecurity is rising again due to climate impacts and COVID. Some countries are seeing reductions in life expectancy. In part this is due to COVID, but in some cases these reductions predated the pandemic.
We expect dramatic impacts on wellbeing from the combination of climate change and biodiversity loss. Researchers have mapped over 400 different pathways in which climate change can impact wellbeing. International reports have shown we are not as prepared as we thought we were.
At the same time, humanity is generally better placed to avoid the worst-case environmental outcomes and to deal with the impacts than centuries ago. The average person has more education and more freedom than in 1800. While arguably dysfunctional, there is international cooperation today that would have been unthinkable a century ago.
Beyond simple narratives of growth
Along with the growing sense of global environmental crises there is a building sense that we need new measurements to describe progress. New measurements that eschew simplistic interpretations – like how a growing GDP means a better society and healthier planet – can highlight how human flourishing is also dependent on inclusion in society and the health of our environment. There is a demand for embracing a more complex picture of human fulfilment. Beyond-GDP, or WISE, approaches attempt to capture the more complex picture of human fulfilment, including our agency in society and long-term sustainability. To learn more about Beyond-GDP measures see the tabs above see the WISE database for a collection of long-term data on beyond-GDP indicators and indexes.